Skip to content
Resource library

Practical guides for the patient journey.

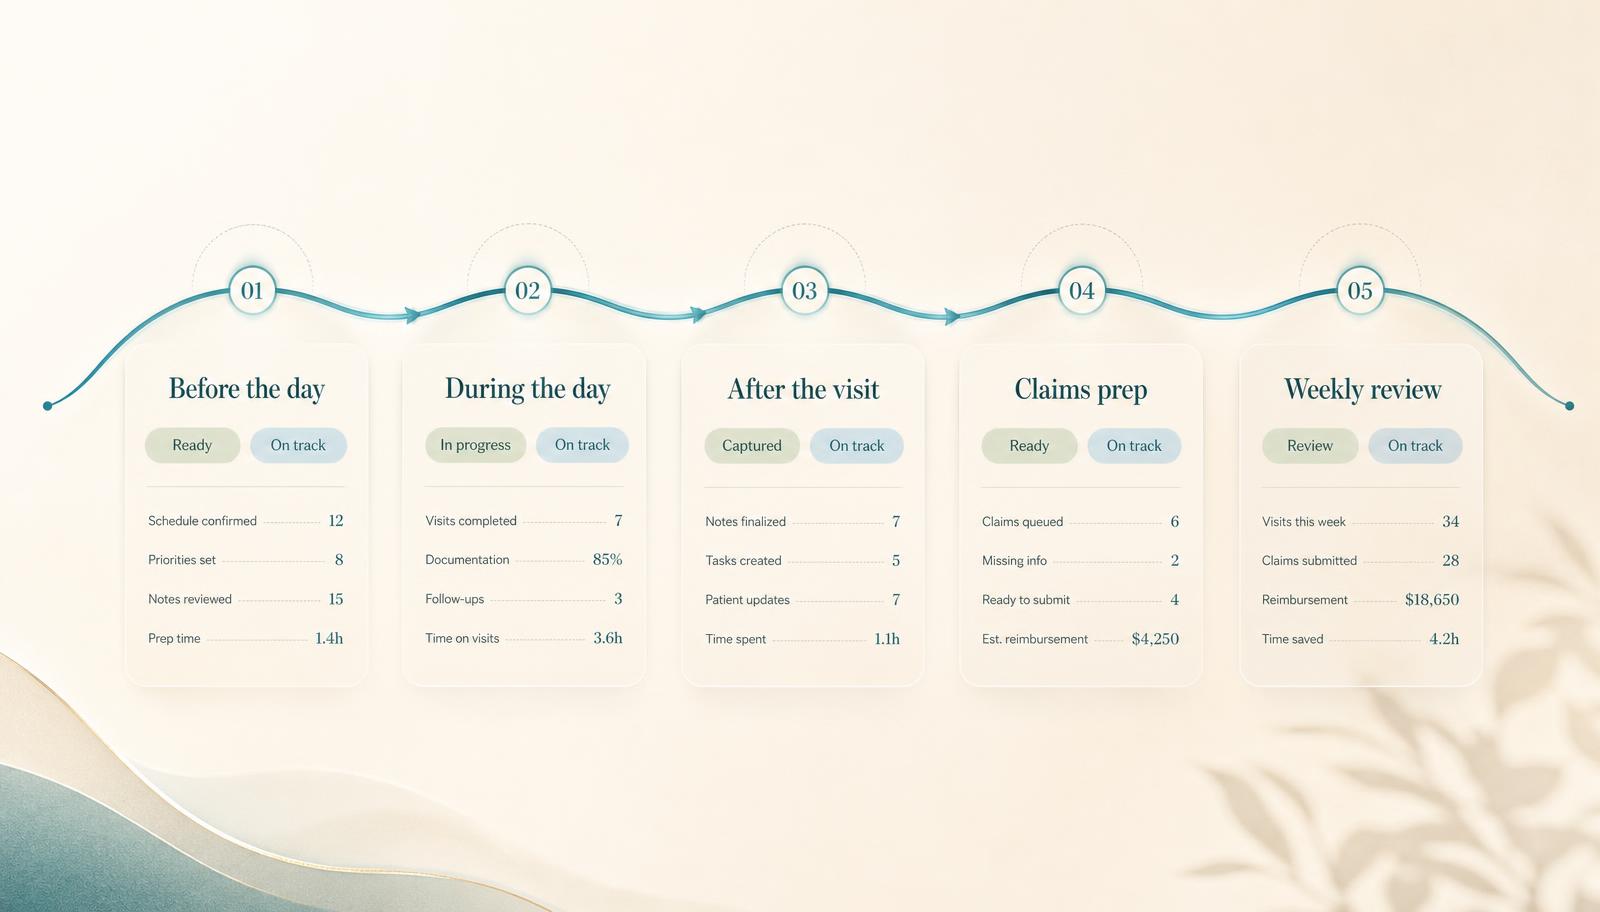
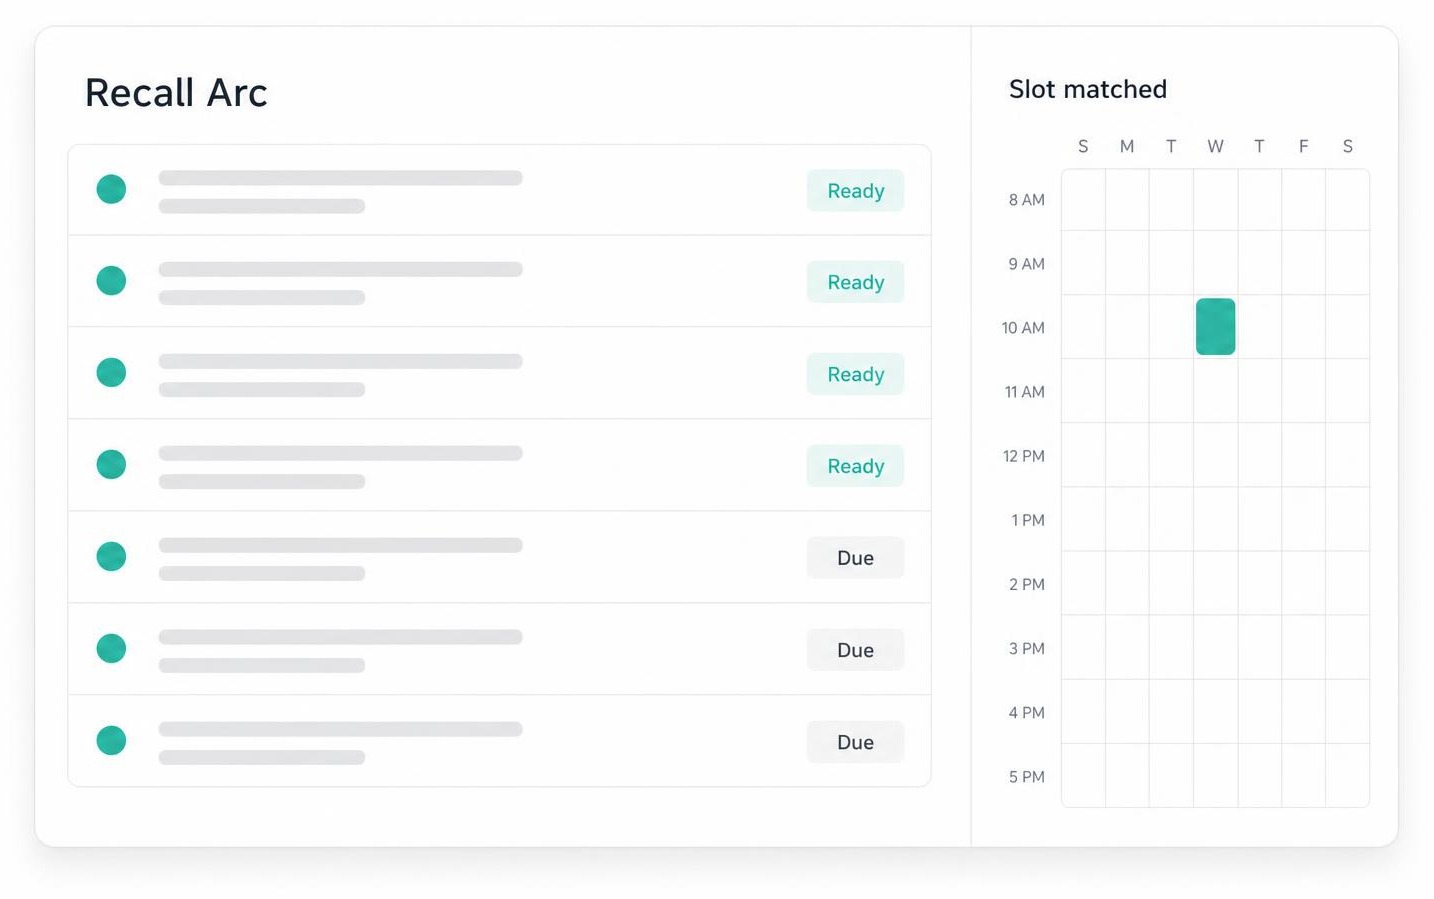
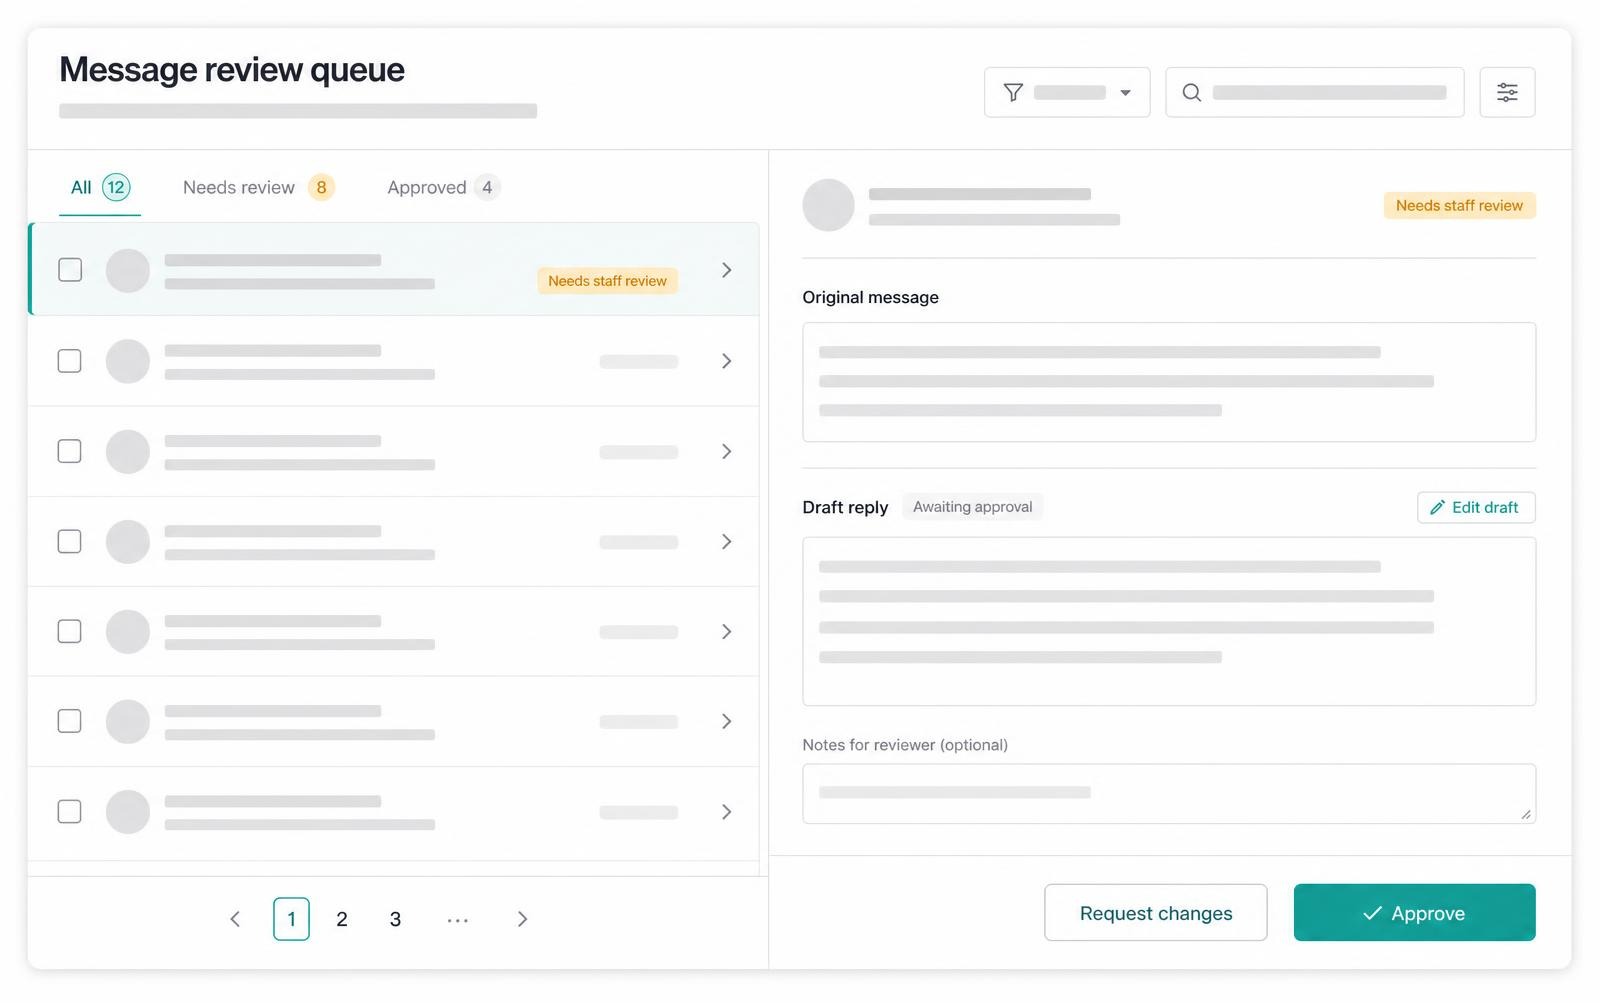
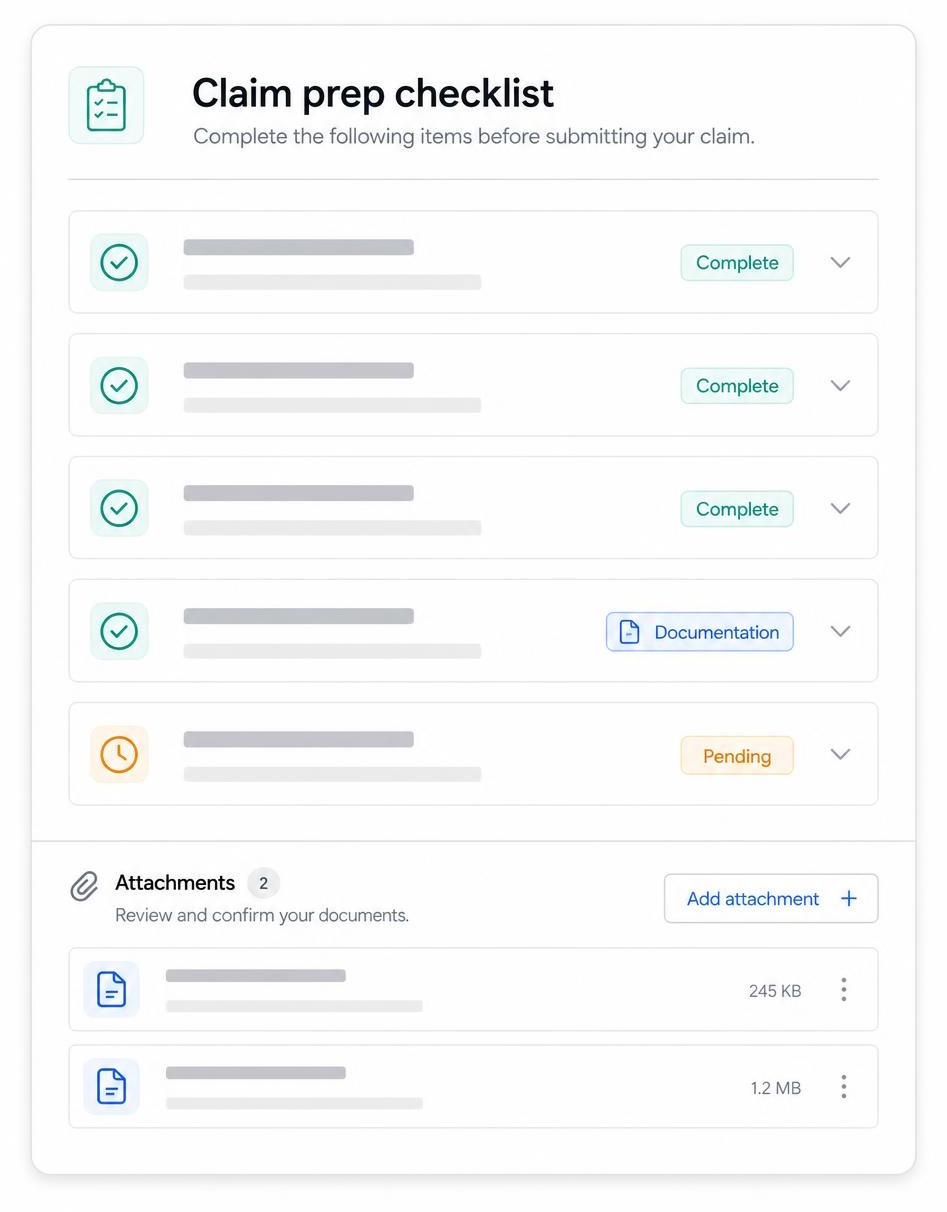
Working notes on recall, open loops, the communication queue, treatment follow-up, benefit tasks, and claim-prep checklists — alongside verified results from teams running PatientArc.

Verified results

Tier 1 DSO, Southwest RegionAnonymized under NDA

A Tier 1 DSO reduced daily schedule gaps from 12% to 7.4%.

PatientArc deployed Daily Brief and Open Chair Recovery across 14 clinics to synchronize front-office operations, reduce production leakage, and surface insurance status earlier in the day. The team moved from printed schedules, portal logins, and spreadsheet recall audits to a reviewed patient journey layer connected to PMS appointment books and eligibility feeds.

Schedule gaps

7.4%

from 12%

Insurance verification

<30 min/day

from 4.2 hrs/wk
  • Schedule gaps reduced from 12% to 7.4%.
  • Insurance verification time reduced from 4.2 hours per week per office manager to under 30 minutes per day.
  • Average administrative prep time reduced by 90 minutes per day per location.
  • Unbilled insurance claims from missed eligibility checks reduced by 18%.

Methodology: PMS Production vs. Scheduled reports compared with staff time-tracking logs, October 12, 2024 to present.

"The visibility into schedule risk before the morning huddle changed our throughput. We stopped reacting to holes in the day and started filling them before the patient even walked in. The multi-tenant view allowed me to see which locations were struggling with recall lag in real-time."

VP of Operations, Tier 1 DSO, Southwest Region

Title and quote only. Do not publish the organization name or individual name.
Workflow story

Reduction of Production Leakage in a High-Volume Periodontal Practice

A daily Schedule Risk alert flagged three 60-minute Tuesday morning gaps. PatientArc identified Open Chair risk from historical no-show probability and current gap analysis, then surfaced overdue recall patients within 5 miles. Two candidate slots carried Pending Insurance flags, so the office manager reviewed the Ready to Fill list before sending SMS outreach. Two gaps were filled within 2 hours.

$420 in potential lost production recovered for a single morning.

Measurement: PMS Production Report compared with Scheduled Hours; System Log ID #8821-X.

Platform metrics

What the system is doing across every practice on it.

22 practices / 34 locations

Deployed footprint

114 active seats

Staff accounts in use

About 14,200

Patient journeys processed per month

About 42,000

Daily Brief entries generated

64%

Automated flag accept rate

22%

Edit / override rate

11%

Reject / dismiss rate

3%

Manager escalation rate

6.2%

False-positive rate, primarily due to PMS clinic-level data entry errors

100%

Treatment Follow-up actions require manual staff sign-off before patient contact

Source: Internal system event logs in PostgreSQL, January 2025 to May 2026.

How to use these guides

Working playbooks, not case stories.

Each guide takes one part of the patient journey — recall, schedule gaps, the communication queue, treatment follow-up, benefit tasks, claim prep — and lays out the open loops, the next step, and who reviews it. They are written to be run by a front-desk team, with or without PatientArc.

Customer results above are published only with written permission. Everything else on this page is capability guidance — no invented metrics.

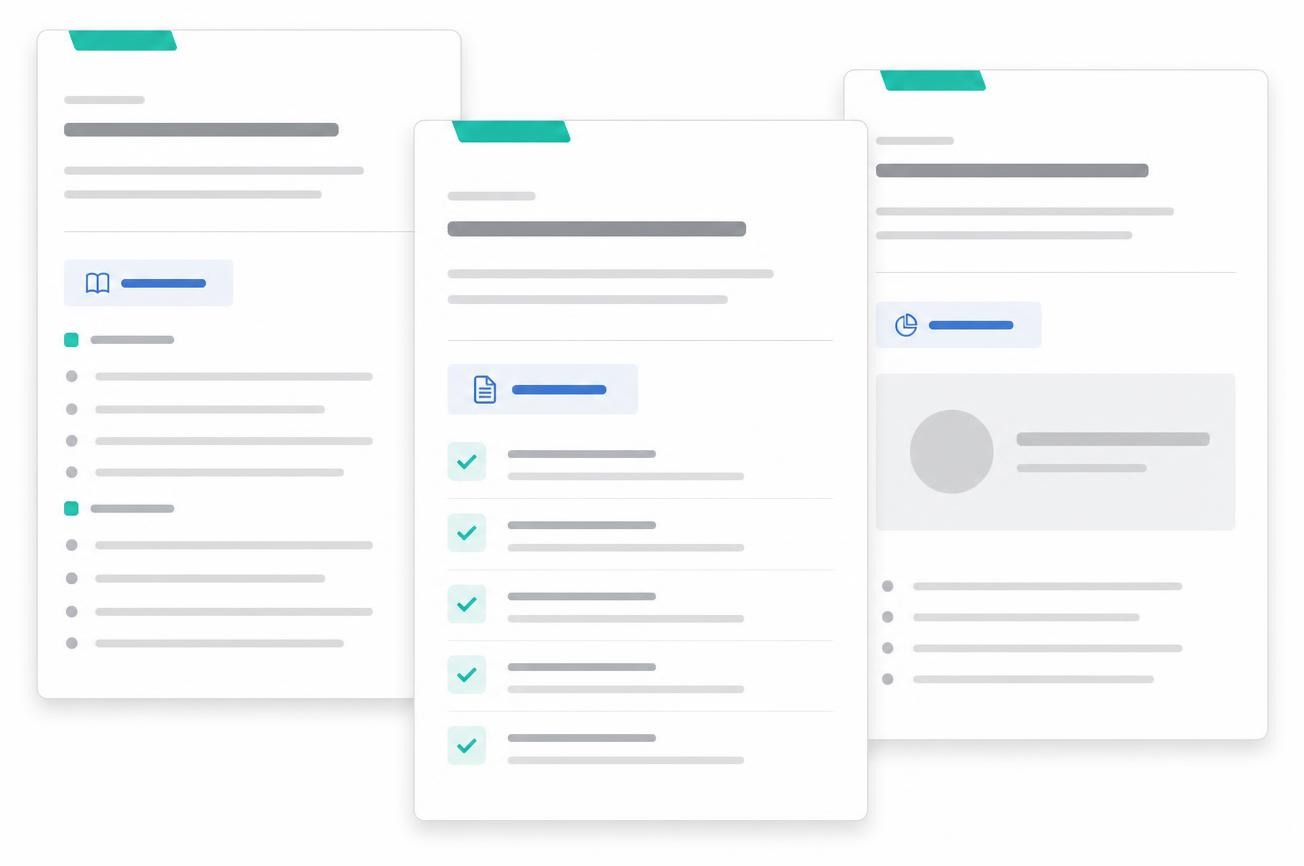
PatientArc playbook cards with mint tabs and blue documentation chips.

Start here

Want to see this running on your schedule?

Walk through the same Daily Brief and Open Chair Recovery workflows referenced above, on your own data.